Common Types of Misleading Statistics in Advertising – And How to Spot Them
In recent years, misleading statistics in advertising have become increasingly prevalent.
Companies and advertisers have realized that statistics can be manipulated to present their products in the best light possible and, as a result, consumers are often presented with a distorted view of the truth.
One of the reasons why misleading statistics are so widespread in advertising is that many consumers are not aware of the techniques used to manipulate data.
In this post, we’ll take a look at the most common types of misleading statistics, the industries that most often use this bad practice, and give you an idea about how to spot them.
Industries Most Affected by Misleading Statistics
While all industries are affected by misleading statistics, some are more susceptible than others. These include:
- weight loss
- health supplements
- the tobacco industry
One of the most common types of misleading statistics used in advertising is the use of small or skewed sample sizes. This can cause a distorted view of the data and present an inaccurate representation of the results.
For example, a weight loss supplement may claim to have helped 90% of users lose weight, but if the sample size was only 10 people, this claim is not statistically significant and may not be applicable to a larger population.
Another technique used to manipulate data in advertising is cherry-picking data. This involves selecting only the data that supports a particular claim, while ignoring other data that may contradict it.
For example, a tobacco company might highlight a study that shows a decrease in smoking-related diseases among a specific demographic group to suggest that smoking is not as harmful as commonly believed, while conveniently ignoring numerous other studies that demonstrate the overall significant health risks associated with smoking.
Related Content: 187 Online Advertising Statistics: Privacy, In-App, PPC, Social and More
Combating Misleading Statistics
The use of misleading statistics in advertising has a significant impact on consumer trust and decision making.
When a consumer is presented with misleading information, they may make an uninformed decision, which ultimately harms their health or finances. This can lead to a loss of trust in the advertising industry as a whole, and consumers may become skeptical of any advertising claims they encounter.
As consumers become more aware of the techniques used to manipulate data in advertising, they are demanding more transparency and honesty from companies. This has led to the rise of several organizations that play a role in regulating advertising in order to provide consumers with accurate information about products.
Advertising Standards Authority (ASA)
The Advertising Standards Authority (ASA) is the UK’s independent regulator of advertising across all media. Its role is to ensure that advertising is legal, decent, honest and truthful. The ASA has specific guidelines on the use of statistics in advertising and actively monitors ads to ensure they comply with these guidelines.
Federal Trade Commission (FTC)
The Federal Trade Commission (FTC) is the U.S.’s consumer protection agency. It has the power to take legal action against companies that engage in deceptive advertising practices, including the use of misleading statistics. The FTC takes a proactive approach to monitoring advertising and takes action against companies that make false or unsubstantiated claims.
Consumer advocacy groups often have close relationships with these regulatory bodies, which allows them to advocate for consumer rights and raise awareness of deceptive advertising practices.
You can report fraudulent product claims and misleading ads to:
- the FTC at ReportFraud.ftc.gov
- or to your state attorney general‘s consumer protection site
Independent Product Reviews
Independent product reviews are conducted by impartial experts or everyday consumers who test and evaluate products based on various criteria such as performance, quality, durability and value for money. These reviews offer valuable insights into the strengths and weaknesses of products, allowing potential buyers to weigh their options objectively.
There are numerous independent product review sites that provide unbiased assessments and evaluations of a wide range of products, including:
- Consumer Reports: This reputable nonprofit organization conducts extensive testing and research on various consumer products. They provide in-depth reviews, ratings, and buying guides to help consumers make informed decisions.
- Wirecutter: This site, owned by The New York Times, offers expert reviews and recommendations on a wide range of products. Their team of experienced journalists and experts thoroughly researches and tests products to provide unbiased and reliable information.
- CNET: This is a trusted technology and consumer electronics review site. They provide comprehensive reviews, ratings, and buying advice on products ranging from smartphones and laptops to home appliances and smart gadgets.
- Good Housekeeping: This popular magazine and website features independent product reviews across various categories, including home appliances, beauty products, and household items. Their experts rigorously test products to assess their performance, safety, and overall value.
- TripAdvisor: This well-known platform for travel-related reviews and recommendations allows users to share their experiences and provide feedback on hotels, restaurants, attractions, and more, helping travelers make informed choices.
- Yelp: This is a widely used platform that allows consumers to review and rate local businesses, including restaurants, retail stores, and service providers. It provides a community-driven platform where people can share their experiences and opinions.
It’s worth noting that while these sites strive to provide unbiased information, it’s always a good idea to consider multiple sources and reviews to form a well-rounded perspective.
Consumer Watchdog Groups
A consumer watchdog group is an organization or entity that actively monitors and investigates business practices, products and services to protect consumer rights and ensure fair and ethical practices in the marketplace.
They scrutinize advertising claims and practices to identify instances of misleading statistics or deceptive marketing techniques in an effort to hold companies accountable and raise awareness among consumers about potential pitfalls or misrepresentations.
The most common consumer watchdog groups include:
- Consumer Federation of America: CFA is a nonprofit organization that advocates for consumer rights and protections. They conduct research, education and advocacy campaigns on various consumer issues, such as product safety, financial services and consumer privacy.
- Public Citizen: This is a nonprofit organization that focuses on consumer advocacy and corporate accountability. They work to protect consumer interests in areas such as healthcare, product safety and financial regulation, while also promoting transparency and fair trade practices.
- Better Business Bureau: The BBB is a nonprofit organization that acts as an intermediary between businesses and consumers. They provide ratings, reviews and dispute resolution services to help consumers make informed choices and address complaints against businesses.
This rise in demand for transparency and the availability of independent resources has encouraged companies to be more cautious in their advertising practices. Many businesses now recognize the importance of building trust and credibility with their customers by providing accurate and reliable information.
Consequently, some companies have embraced transparency initiatives, such as disclosing their sourcing methods, manufacturing processes or third-party certifications, to demonstrate their commitment to honesty and authenticity.
Techniques Used to Manipulate Data in Advertising
There are a range of techniques used to manipulate data in advertising, and understanding these techniques is essential for consumers to make informed decisions about the products and services they choose to buy. By being aware of these techniques, consumers can avoid being misled by false advertising claims.
Here are the most common types of misleading statistics – and how to spot them.
Cherry-Picking Data
Cherry-picking data involves selecting only the data that supports a particular claim, while ignoring other data that contradicts it. This can give a skewed view of the information and present an inaccurate representation of the results.
For example, a company may only showcase the positive reviews of a product, while ignoring the negative reviews. This can lead consumers to believe that the product is universally well-received, when in reality, there may be a significant number of dissatisfied customers.
How to spot this technique:
- Look for the complete picture: Examine whether the presented statistic provides a comprehensive view of the topic or if it only focuses on a single data point.
- Seek additional sources: Don’t rely solely on the information provided in the advertisement. Look for independent sources, such as reputable research studies or industry reports, to gather a broader perspective on the topic.
- Evaluate sample size and representativeness: Consider whether the sample size used in the statistic is sufficient and representative of the target population.
- Examine the source of the statistic: Determine the credibility and expertise of the source providing the statistic. If the source has a vested interest or lacks objectivity, scrutinize whether the advertisement provides references to validate the statistic.
- Seek context and supporting evidence: Look for contextual information that helps you understand the statistic’s relevance and significance. A single statistic without proper context may lead to misinterpretation.
- Trust your instincts and be skeptical: Develop a healthy level of skepticism when encountering advertising claims and statistics. If something appears too good to be true or lacks transparency, it is essential to question the validity of the presented data.
Misrepresenting Sample Sizes
Misrepresenting sample sizes is another technique used to manipulate data in advertising. Companies may use small sample sizes, which can lead to a distorted view of the results. Alternatively, they may use a sample size that is not representative of the target population, which can lead to an inaccurate representation of the data.
For example, a company may claim that 90% of their customers are satisfied with their product, but only surveyed 10 people. This sample size is not large enough to accurately represent the views of the entire customer base, and may not be statistically significant.
How to spot this technique:
- Look for sample size disclosure: Examine whether the advertisement provides information about the sample size used to generate the statistic. Transparent and trustworthy sources typically disclose the sample size to lend credibility to their claims. Lack of sample size information or vague references to “a study” without specific details can raise suspicion.
- Evaluate sample size in relation to the claim: Consider whether the sample size used in the study or survey is appropriate for the claim being made. Different types of claims may require larger or more representative sample sizes to yield statistically reliable results. Extraordinary claims based on small sample sizes should be examined more critically.
- Assess representativeness: Determine if the sample used in the study or survey is representative of the target population. A truly representative sample should reflect the demographic, geographic, or other relevant characteristics of the broader population. If the sample is not adequately representative, the results may not be generalizable or applicable to the larger population.
Using Ambiguous or Vague Terms
Another technique used to manipulate data in advertising is the use of ambiguous or vague terms.
For example, advertisers may claim a product is “clinically proven,” without specifying which study or trials they are referring to. This can lead to confusion for consumers and an inaccurate representation of the efficacy of the product.
Similarly, claims such as “all-natural” or “organic” may not have a standardized meaning, and can be used by companies to make their products seem healthier or more environmentally friendly than they actually are.
How to spot this technique:
- Scrutinize the wording: Pay close attention to the specific terms and phrases used in the statistic or claim. Look for overly general or ambiguous language that lacks clarity and precision. Vague terms may include words like “many,” “most,” “some,” or “a significant number.”
- Seek concrete numbers or specifics: Look for specific and quantifiable information within the statistic. Misleading ads often rely on vague terms to avoid providing concrete numbers or meaningful details. Concrete numbers or specific percentages provide a clearer picture and allow for better evaluation.
- Look for contextual information: Evaluate whether the advertisement provides sufficient context and supporting details to explain the statistic. Ambiguous or vague terms may be used to create a sense of importance or superiority without substantiating evidence. Lack of specific examples, references, or data sources can indicate a lack of credibility.
- Consider the absence of benchmarks or comparisons: Misleading ads may use ambiguous terms to avoid making direct comparisons or benchmarks against relevant standards. Look for the absence of clear references to industry standards, competitor performance, or other relevant benchmarks. This lack of comparison can make it challenging to evaluate the significance of the statistic.
- Analyze the overall message: Assess the broader message conveyed by the advertisement. Misleading ads often use ambiguous terms to create a positive impression without providing substantive evidence. If the statistic is presented in a way that seems more focused on persuasion than providing factual information, it is worth investigating further.
- Evaluate the source and credibility: Consider the credibility and expertise of the entity or source presenting the statistic. Misleading ads may rely on vague terms to mask a lack of reliable data or to exaggerate claims. Investigate whether the source is reputable and known for accurate information.
- Cross-reference with reliable sources: Seek additional information or data from independent and trustworthy sources. If the advertisement fails to provide specific information, reliable sources can help verify or refute the claims made. Multiple sources with clear and concrete information enhance the credibility of the statistic.
Manipulating Graphs and Visuals
Finally, manipulating graphs and visuals can be another technique used to manipulate data in advertising. Advertisers may use visual aids that do not accurately represent the data, or make changes to the scale of the graph to make the results appear more impressive than they really are.
For example, a graph may be designed to exaggerate the difference between two data points, making it seem like there is a larger gap than there actually is. Alternatively, a graph may have a y-axis that starts at a number greater than zero, making a small difference seem much larger than it really is.
How to spot this technique:
- Examine the axes: Look closely at the axes of the graph or visual representation. Misleading ads may manipulate the scale or range on the axes to exaggerate or minimize the impact of the data. Pay attention to the units of measurement and the intervals between values.
- Assess the proportions: Evaluate whether the proportions and sizes of the elements in the graph accurately represent the data being presented. Misleading ads might manipulate the size of the bars, pie slices, or other visual elements to distort the perception of relative values or percentages.
- Check for truncated or omitted data: Look for any signs of truncated or omitted data points on the graph. Misleading ads may selectively remove data points or truncate the axis to make the differences between data points appear more significant or visually impressive.
- Consider the baseline: Evaluate the choice of baseline or starting point on the graph. Misleading ads might manipulate the baseline to create an illusion of larger or more dramatic changes. By selectively choosing a specific baseline, the advertiser can distort the perception of growth, improvement, or decline.
- Assess the use of 3D effects: Be cautious of excessive or unnecessary 3D effects in graphs or visuals. While 3D elements can make a graph visually appealing, they can also introduce distortions that misrepresent the actual data. Pay attention to whether the 3D effects enhance understanding or simply serve as a visual trick.
- Consider the overall narrative: Evaluate the narrative or message conveyed by the advertisement. Misleading ads may use manipulated graphs or visuals to support a predetermined storyline or to emphasize a specific point without accurately reflecting the underlying data. Assess whether the visuals align with the overall credibility and transparency of the ad.
More Misleading Statistics in Advertising
Here are several more examples of commonly observed misleading statistics in advertising that you should look closely at before accepting the claim as authentic:
- Correlation without causation: Suggesting a cause-and-effect relationship between two variables based on their correlation, even though other factors may be at play.
- Outdated statistics: Using outdated data to support a claim, which may not accurately reflect the current state of affairs.
- Comparative exaggeration: Exaggerating the benefits of a product or service by selectively comparing it to inferior alternatives.
- Limited-time offers: Creating a sense of urgency by highlighting limited-time promotions or discounts without disclosing the actual frequency of these offers.
- False testimonials: Presenting fabricated or misleading testimonials from satisfied customers to bolster the credibility of a product or service.
Related Content (with Sources!):
* 75+ CRO Statistics That’ll Help You Increase Sales in 2023
* 100 SEO Statistics That’ll Help You Dominate Search Rankings in 2023
Case Studies of Misleading Statistics in Advertising
There are numerous case studies of misleading statistics in advertising, and these can provide valuable insights into how these techniques are used in practice. Here, we’ll take a look at three from the industries that most often employ misleading statistics.
The Tobacco Industry’s Manipulation of Data
The tobacco industry has a long history of manipulating data to downplay the risks associated with smoking. For instance, in the 1950s, the industry commissioned a research committee that created industry-sponsored research which downplayed the link between smoking and cancer.
“This tactic offered several essential advantages. The call for new research implied that existing studies were inadequate or flawed. It made clear that there was more to know, and it made the industry seem a committed participant in the scientific enterprise rather than a self-interested critic…. [The] research program would be controlled by the industry yet promoted as independent.”
This was a classic case of cherry-picked data to support its claims. This “research” was widely criticized by the scientific community, but it succeeded in creating doubt in the minds of consumers about the link between smoking and cancer. This doubt allowed the tobacco industry to continue selling their products for many years, even as evidence mounted about the dangers of smoking:
In addition to commissioning studies, the tobacco industry has also used statistics that show that only a small percentage of smokers develop lung cancer, without mentioning that smoking increases the risk of many other health problems, such as heart disease and stroke.
By focusing on a single statistic, the tobacco industry was able to create the impression that smoking was not as dangerous as it really is.
Weight Loss Product False Claims
Advertisers may use small sample sizes or manipulate graphs to make it appear that their weight-loss product is more effective than it really is. An advertiser may conduct a study with biased “researchers” and a small sample size and then claim that their product resulted in a 50% weight loss, without mentioning that the study only included a handful of people.
Or, as in the case of Sensa’s weight loss powder, they may simply use language like “clinically proven” without linking to any studies:

Sensa Products, the CEO Adam Goldenberg and their paid endorser Dr. Alan Hirsch were ordered to pay $26.5 million as part of a $46.5 million judgment.
This type of misleading statistic can be particularly dangerous, as it can lead consumers to believe that a product is safe and effective when it is not:

In addition to manipulating statistics, weight loss product advertisers also often use before-and-after photos in their advertising. These photos can be manipulated in a variety of ways, such as using different lighting or camera angles, to make it appear that the product is more effective than it really is.
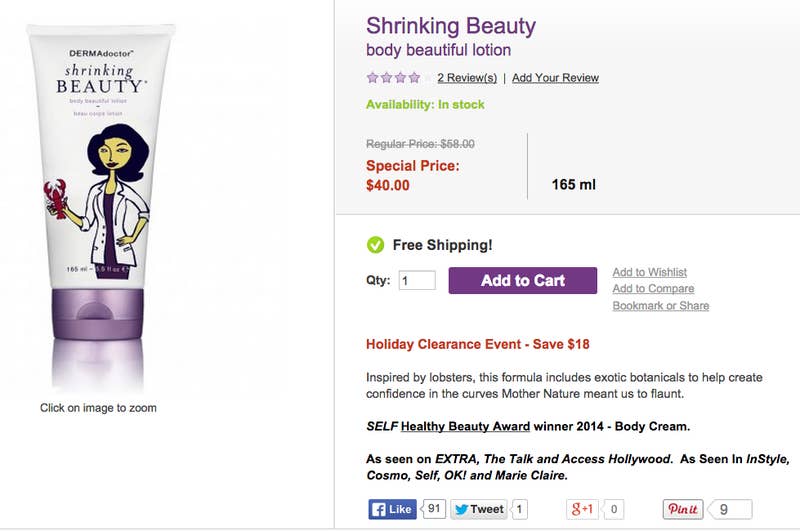
By the way, it’s worth looking at this list of incredible weight-loss claims, including one ad for “lobster-inspired slimming cream…that simulates a lobster’s ability to shrink its body”:
Misleading Food and Beverage Health Claims
Companies in the food and beverage industry often make claims that their products are healthy or low in calories without providing accurate data to support these claims. A company may claim that their product is “low-fat” or “low-calorie” without mentioning that it is also high in sugar or sodium.
Maple Leaf Foods’ deli meat states on the package “no added preservatives” even though it actually contains nitrite, which is a preservative that is linked to cancer. Although the company denied that its labels were misleading, it later amended their packaging to say that their deli meat does contain nitrite after a CBC Marketplace investigation.

In addition to misleading claims about the nutritional content of their products, food and beverage companies also often use statistics in their advertising to create the impression that their products are more popular or healthier than they really are.
For instance, a brand may claim that their product is the “number one choice” of consumers, without mentioning that this claim is based on a small survey of a select group of people.
Last Word on Misleading Statistics in Advertising
Misleading statistics in advertising can have a significant impact on consumer trust and decision making, and it is essential for consumers to be aware of these techniques to make informed decisions about the products and services they choose to buy.
By understanding the techniques used to manipulate data in advertising and the role of regulatory bodies in combating this issue, consumers can help to ensure that advertising claims are accurate and not misleading.
If you’re ready to level up your business with trust and transparency, Single Grain’s paid ads experts can help!👇
The post Common Types of Misleading Statistics in Advertising – And How to Spot Them appeared first on Single Grain.